Dashboards choose your way
Whenever you’re using interfaces like Grafana or want to keep independent solution – Monit24 is for you.
Default dahboard
Get started quickly with template dashboards or customize them. Dashboards enable your team to immediately benefit from dynamic views with no query language or coding required.
Synthesize all of your data with the click of a button
See performance overviews and metrics side-by-side for alignment and easy correlation. Explore your logs, UX and network performance together for complete visibility.
HAR
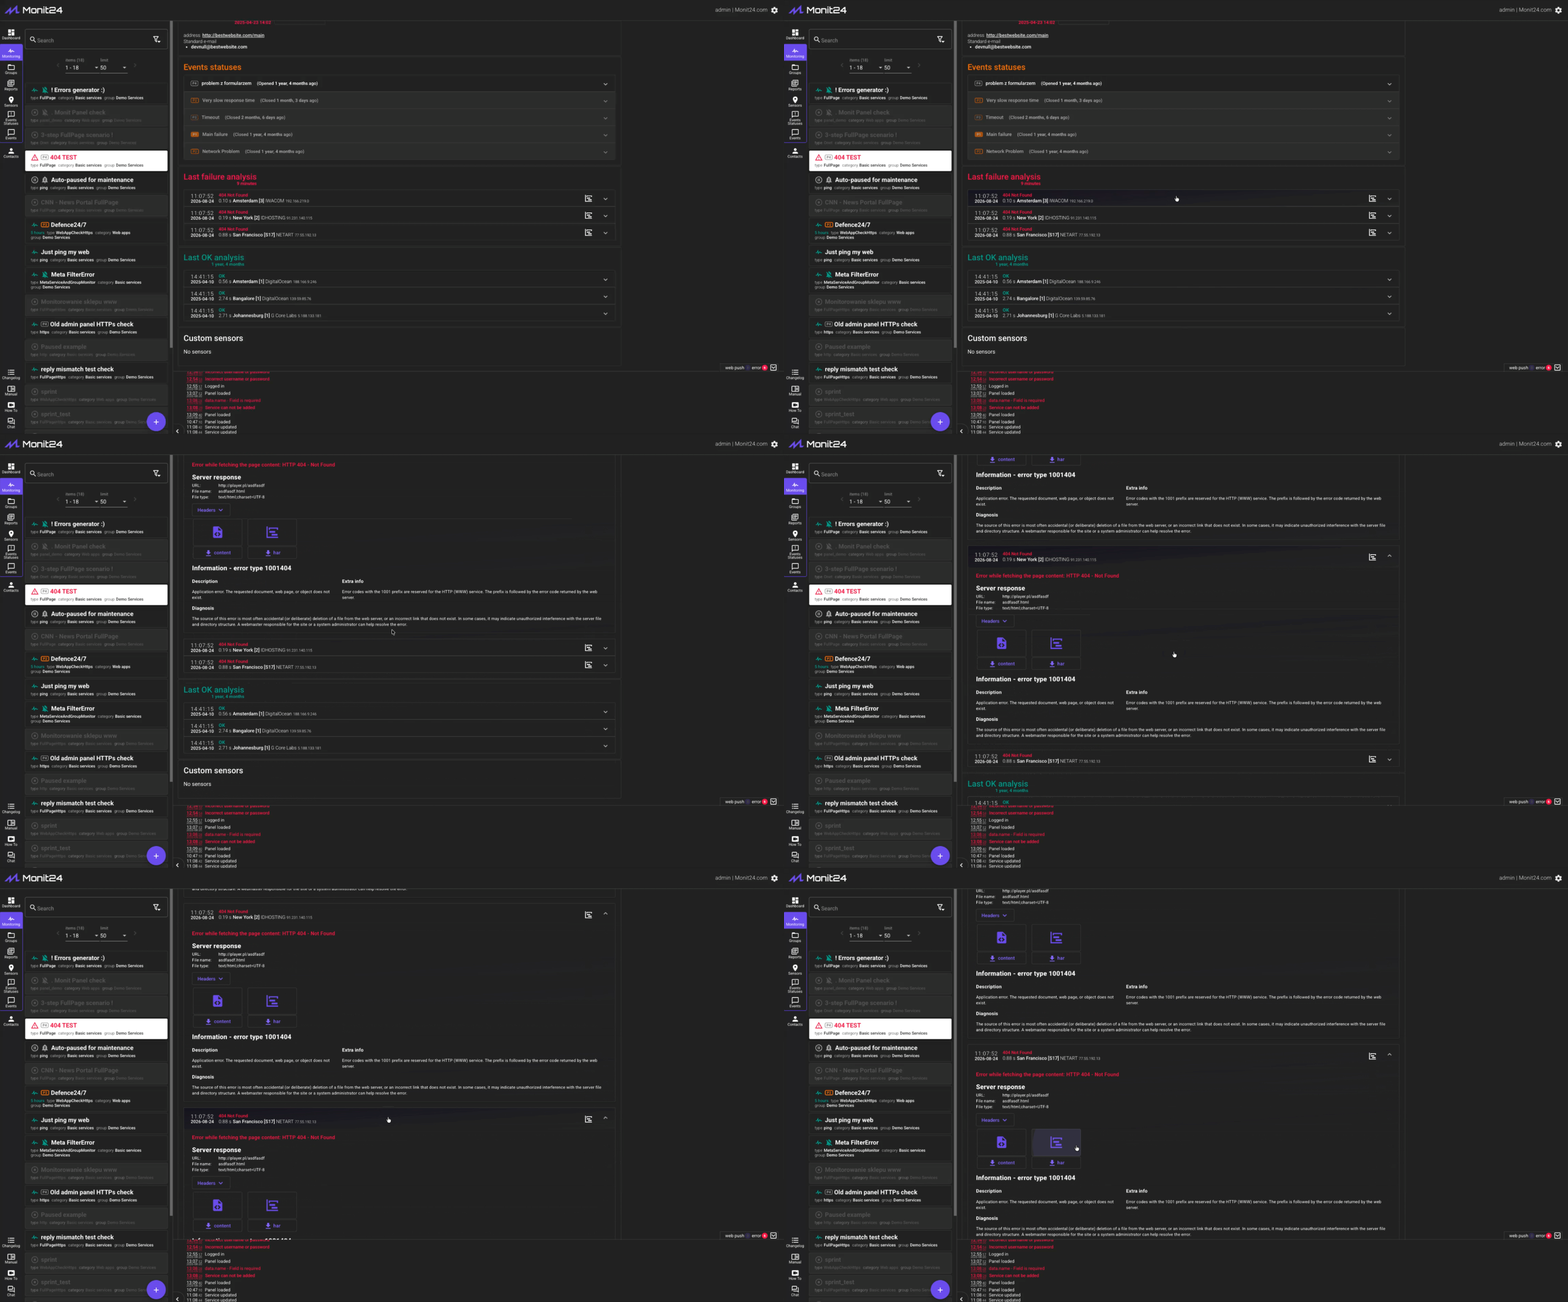
HAR diagrams help you visualize every request, response, and loading delay in your web application monitoring workflow. With HAR-based analysis, you can quickly identify slow APIs, failed resources, redirects, and performance bottlenecks affecting user experience.

Still searching?
It seems you have a non-standard problem to solve. You couldn’t have found a better place – we love challenges. We go further where everyone else gives up. Contact us so we can learn your needs and propose the right solution for you.


Check how Monit24 works.